
Published Oct 7, 2026
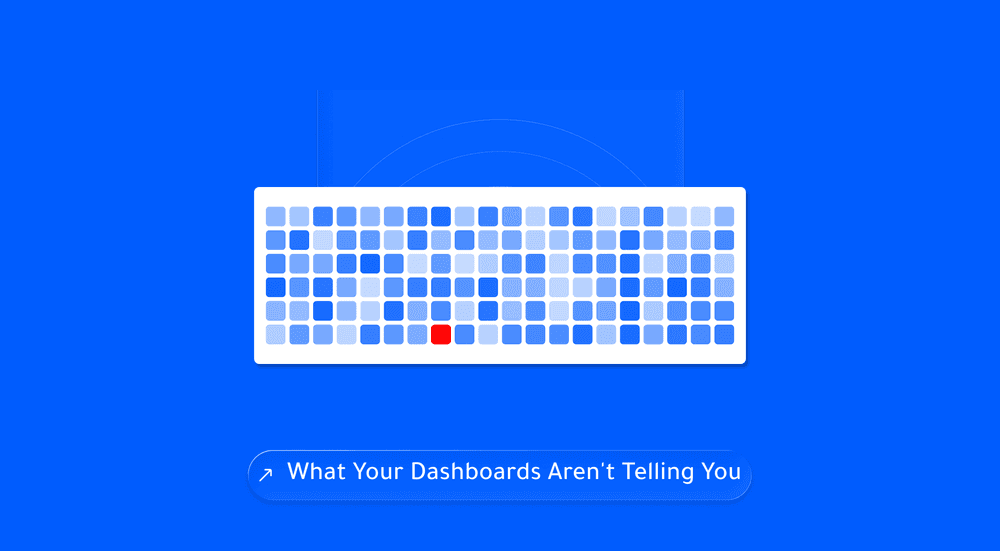
Monday morning. A founder opens her laptop before the team arrives, coffee in hand, and pulls up the numbers. Instagram reach: up 40% this month. Facebook page likes: up 12%. Website visits: up almost 2,000. Everything on the screen is green, trending up, arrows pointing the right way.
Then she opens the bank statement. Revenue is flat. Actually, it is down slightly from last month. She calls the sales lead and asks what is going on, and gets a shrug: "Leads have been slow the last few weeks." Slow compared to what? Nobody can say, because nobody wrote last month's lead count down anywhere.
This is not a story about a founder who does not care about numbers. It is the opposite — she is looking at numbers every single day. The problem is that none of the numbers she is looking at can actually answer the one question that matters: is the business growing, and why or why not. That is the gap this post is about.
What Real Performance Tracking Actually Is
Performance tracking is not a dashboard. It is not a spreadsheet with forty tabs, and it is not a monthly PDF report that gets skimmed once and archived. Real performance tracking is a small, fixed set of numbers that map directly to a business decision, checked on a schedule you actually keep.
Think of it like the dashboard in a car. A car has hundreds of sensors — engine temperature, oil pressure, tire pressure, dozens of electrical readings the onboard computer is tracking every second. But the dashboard in front of the driver shows maybe six things: speed, fuel, an engine temperature warning, battery, and a couple of alert lights. That is not because the other data does not exist — it is because the driver only needs a handful of numbers to make the decisions that matter while driving: slow down, pull over, get fuel. Everything else stays in the engine's computer, available if a mechanic needs to dig into it later, but off the driver's dashboard.
Most SME owners are running their business with either no dashboard at all — driving by feel — or with every single sensor reading dumped onto the windshield at once, which is just as useless as having none. Real tracking means picking the six or seven numbers that actually tell you whether to speed up, slow down, or change direction, and looking at them on a fixed schedule.
Why the Default Approach Fails
Most founders do not set out to build a bad tracking system. They just default to whatever is easiest to see, and that default breaks down in a few predictable ways.
The "Vanity Metrics" Trap
This is the most common one. Reach, impressions, likes, follower counts, and video views are the easiest numbers to find — they are sitting right there on the home screen of every social platform, presented in bright colors with upward arrows. They feel like progress. But none of them tell you whether a single new client walked through the door. A post can reach 50,000 people and generate zero leads. A page can gain 500 followers in a month and close zero deals. Vanity metrics measure attention, not business outcomes, and treating them as a proxy for growth is how a founder ends up celebrating a great month on Instagram while revenue quietly stalls.
The "Too-Many-Metrics" Trap
This is the overcorrection. A founder reads that tracking matters, asks someone to "build a dashboard," and ends up with a spreadsheet or BI tool with thirty or forty tracked numbers — reach by platform, engagement rate by post type, click-through rate by ad set, bounce rate by landing page, and on and on. It looks impressive in a screenshot. Nobody opens it after week two. A dashboard that requires twenty minutes to interpret is a dashboard that gets ignored the first time someone is busy, and everyone running a business is always busy. Complexity is not rigor — it is usually just noise wearing rigor's clothes.
The "No-Baseline" Trap
This one is subtler. A founder does track something real — say, leads generated this month: 50. But 50 compared to what? Without last month's number, without an average across the last quarter, without a target, 50 is just a number floating in space. Is 50 leads a great month or a disaster? Nobody can say, because there is no baseline to measure it against. A number without a comparison point is not a metric — it is trivia.
Signs You Are Stuck in This Problem
A few honest questions tend to surface this fast:
- You can quote your Instagram or Facebook follower count from memory, but you would have to go digging to find out how many leads came in last month.
- You have never sat down and compared this month's numbers to last month's, side by side, on purpose.
- Your "reporting" is really just four browser tabs open at once — Meta Business Suite, Google Analytics, your ad account, maybe a CRM — with nothing pulled together into one place.
- Marketing decisions in your business get made based on what "feels like" it is working, not on a number anyone checked first.
- You or someone on your team built a tracking sheet or dashboard at some point, and it has not been opened in weeks — maybe months.
- If someone asked you right now, on the spot, "what is your cost per lead this month" or "what percentage of leads actually become paying clients," you could not answer within about ten seconds.
If two or more of those sound familiar, the tracking system — or lack of one — is quietly costing the business money, because decisions are being made without the information needed to make them well.
A Hypothetical Example
To make this concrete, imagine a hypothetical business — a mid-sized furniture and home decor showroom, running both a physical store and social media promotion, somewhere in Algeria. This is an illustrative scenario only, not a real client or a real data set, and none of the figures below should be read as verified results.
For the first year, the owner tracks nothing beyond what Instagram shows natively: reach, likes, story views. Every month he posts new furniture arrivals, reach climbs, comments come in, and it feels like the business is gaining ground. But when he looks at the till at the end of each month, revenue bounces around unpredictably, and he cannot tell which months were driven by marketing and which were just walk-in traffic tied to the store's location.
Now imagine he switches to tracking five numbers instead: leads (WhatsApp messages and calls that mention a specific product), cost per lead on the boosted posts he runs, how many of those leads actually visited the showroom, how many of those visits became a sale, and the average sale value. In this hypothetical, after a few months of consistent tracking, a pattern that was invisible before becomes obvious: posts about bedroom sets generate far more leads than posts about individual accent pieces, but accent-piece leads convert to a sale at a noticeably higher rate because they are a smaller, easier purchase decision. That single insight — invisible in reach or likes, visible only once real numbers were tracked side by side — could reasonably reshape what gets posted and promoted going forward.
Nothing about this example is a real result or a promise of what any specific business will see. It is meant to illustrate the mechanism: the right five numbers, tracked consistently, surface decisions that vanity metrics never could.
The Metrics That Actually Matter (And the Tools to Track Them)
Here is the deep-dive: for most SMEs, a working performance tracking system needs somewhere between five and eight numbers — not forty, not zero. These are the ones that come up again and again as the numbers that actually connect to revenue.
1. Leads generated, by source
Not just "leads" as one blended number, but leads broken out by where they came from — organic social, paid ads, referrals, walk-ins, website form. This is what tells you which channel is actually producing, versus which one just feels active because it is the one you post on most.
2. Cost per lead, for anything running paid ads
Total ad spend divided by the number of leads generated in that period. This is the number that tells you whether a campaign is efficient or quietly burning cash while impressions climb. A campaign can have excellent reach and a terrible cost per lead at the same time — reach alone will never surface that.
3. Lead-to-client conversion rate
Of the leads generated, what percentage actually became paying clients. This is where marketing and sales performance meet, and it is exactly the number this series covered in Blog 4 on marketing-sales alignment — if marketing is generating leads but this number is low, the leak is not in marketing, it is in what happens after the lead arrives.
4. Average deal value
Not every client is worth the same amount. Tracking this prevents a common trap: celebrating "more leads" when the new leads are worth a fraction of what past clients were worth, which can quietly mean more work for less revenue.
5. Time-to-close
How long, on average, between a lead first arriving and that lead becoming a paying client. A slow time-to-close often points directly back to the follow-up system covered in Blog 5 — leads that sit unanswered for days lose momentum and go cold, and this number is where that problem becomes visible in black and white instead of staying a vague feeling.
6. Revenue by channel, where trackable
For businesses running paid campaigns or working with a CRM, tying actual closed revenue back to the source of the lead is the number that ends every "should we spend more on ads or more on content" debate with data instead of opinion.
On tools: none of this requires expensive business intelligence software. A shared spreadsheet — Google Sheets works fine — with one row per week or month and these five to eight columns, reviewed on a fixed cadence by the people who can actually act on it, will outperform an expensive analytics platform that nobody logs into. The tool is not the hard part. The habit of updating it and actually looking at it together is the hard part, and that is a discipline problem, not a software problem. This is also exactly why the marketing-sales alignment habits from Blog 4 and the CRM follow-up system from Blog 5 matter here — they are the actual data sources feeding this dashboard. A dashboard is only as good as what feeds it: if leads are not logged consistently in a shared system and follow-up is not tracked anywhere, there is no clean data to pull into this weekly review in the first place.
What I Have Seen Working With SMEs in Algeria
In my experience working with SME owners here in Algeria, the tracking gap tends to show up in a specific pattern: strong instinct for the product or service, real hustle on the marketing side, and almost no habit of writing numbers down anywhere shared. A lot of founders are running the entire commercial side of the business from memory and gut feeling, which works fine when the business is small enough for one person to hold all of it in their head, and stops working the moment the team grows past that point.
I have also noticed that many business owners here associate "tracking" or "reporting" with big-company overhead — something a corporation needs and a small business does not have time for. That is a judgment I would push back on, based on what I have seen in this market: the businesses that struggle most with unpredictable growth are usually not the ones tracking too much detail, they are the ones tracking zero detail and trying to make every decision on instinct alone. This is my own observation from working with SMEs here, not a documented statistic, and I would encourage any founder reading this to check it honestly against their own business rather than take my word for it.
Steps to Take This Week
- Pick five numbers, not fifty. From the list above, choose the five or six that map most directly to how your business actually makes money. If you run paid ads, cost per lead has to be one of them. If you do not, drop it and focus on lead-to-client conversion instead.
- Build one shared sheet. A single spreadsheet, one tab, one row per week. Resist the urge to add more columns in week one — start minimal, you can always add more later once the habit exists.
- Set a fixed review time and put it on the calendar. Not "whenever I get to it" — a specific day and hour, weekly, where whoever owns marketing and whoever owns sales sit down together and fill in and look at the sheet. Fifteen minutes is enough if the sheet is simple.
- Pull your last two to three months of data retroactively, if you can. Even rough numbers from memory or old messages give you a baseline to compare against, so next week's numbers mean something instead of floating in isolation.
- Write last month's numbers at the top of the sheet as a baseline. Every new week gets compared against it, not just admired on its own.
- Turn off, or stop checking, one vanity metric you currently obsess over. Whether that is follower count or a like count, deliberately reduce how much attention it gets, and redirect that attention to the sheet instead.
Common Mistakes to Avoid
Building the perfect system before starting
Waiting for the ideal dashboard or software before tracking anything means months go by with zero data collected. Start with a plain spreadsheet today.
Tracking metrics nobody on the team can actually act on
If a number does not lead to a decision — stop this campaign, follow up with this lead, raise this price — it does not belong in the weekly review, even if it is interesting.
Reviewing the numbers alone
If sales and marketing do not look at the sheet together, the conversion and follow-up numbers lose their context, and the review turns into two separate monologues instead of one conversation.
Changing what gets tracked every few weeks
Constantly swapping metrics makes it impossible to build a real baseline. Pick the numbers, commit to them for at least a full quarter, then adjust.
Confusing a report with a review
Generating a PDF or export and emailing it around is not the same as a live conversation where someone asks "why did this number move" and someone else answers.
Letting the CRM and the dashboard drift apart
If leads are logged in one place and the weekly sheet is filled in from memory instead of pulled from that system, the numbers stop being trustworthy fast.
Frequently Asked Questions
What is the difference between a vanity metric and a real performance metric?
A vanity metric measures attention — reach, likes, impressions, follower growth. A real performance metric measures business outcome — leads, conversion rate, revenue, cost per lead. The test is simple: if the number went up and revenue did not move, it was probably a vanity metric.
How many metrics should a small business actually track?
Somewhere between five and eight, reviewed consistently, is enough for most SMEs. More than that and the review stops happening because it takes too long; fewer than that and important decisions get made blind.
Do I need expensive software to track this properly?
No. A shared spreadsheet reviewed on a fixed weekly or monthly schedule outperforms an expensive BI tool that nobody opens. The tool matters far less than the habit of updating and reviewing it consistently.
How often should performance metrics be reviewed?
Weekly for lead and conversion numbers, monthly for the bigger trend view. Quarterly is too slow to catch a problem while it is still small and cheap to fix.
What if I do not run paid ads — does cost per lead still matter?
No. If there is no ad spend, drop cost per lead and focus on lead-to-client conversion rate and time-to-close instead, since those apply regardless of whether leads come from paid, organic, or referral sources.
Where do the numbers for this dashboard actually come from?
They come from the systems already covered earlier in this series: consistent lead logging from marketing-sales alignment in Blog 4, and consistent follow-up tracking from the CRM system in Blog 5. A performance dashboard is only as accurate as the data feeding it from those two places.
Conclusion
A dashboard full of green arrows means nothing if none of those arrows connect to revenue. The goal was never to track more — it was to track the right handful of numbers, consistently, and actually look at them together on a schedule the business keeps. That is the whole of pillar five of the Growth Machine: not more data, just the right data, seen clearly enough to act on.
If this post resonated because your own reporting is either nonexistent or an overwhelming mess nobody opens, that is usually a sign the systems feeding it — lead tracking and follow-up — need attention first, which is exactly what Blogs 4 and 5 in this series walk through.
But seeing your numbers clearly is only half the job. Once you can actually see what is happening — which channels convert, where leads stall, what a deal is really worth — the next question is what you do with that information. Not a big, risky overhaul every quarter, but small, continuous improvements based on what the data is actually showing. That is the sixth and final pillar of the Growth Machine, and it is exactly what the next post in this series covers: "Stop Guessing. Start Testing."